|
It started in July 1971 with National Security Adviser Henry Kissinger's secret visit to China. Later that month, Richard Nixon wanted to grease the rails for his reelection and announced that he would visit China the following year. Shortly thereafter, in October 1971, we threw Taiwan under the bus and neglected to veto the UN resolution which replaced Taiwan with the PRC. Then in February 1972, Chairman Mao Zedong welcomed Nixon to China, with every president since Nixon stopping by, from Gerald Ford to Barack Obama. George W. Bush was the most frequent traveler, with visits in October 2001, February 2002, November 2005, and August 2008. The first economic sucker punch to strike was NAFTA (North American Free Trade Agreement), which, contrary to popular belief, was created by George H. W. Bush who signed a draft of it in October 1992, but he had to leave it to Bill Clinton to finalize, which he did in two stages, in September and December 1993. Clinton slickly promised: "NAFTA means jobs. American jobs, and good-paying American jobs. If I didn't believe that, I wouldn't support this agreement." Daniel Griswold of the libertarian Cato Institute breathlessly declared in July 1998 that NAFTA "has been a success by any measure." Griswold also opined that "NAFTA and other market reforms softened the severity of the crisis and spurred Mexico's recovery," but to paraphrase from Genesis 4:9, are we our neighboring country's keeper? Giving PNTR (permanent normal trade relations) to China was next. PTNR, also known as most favored nation status, is a required element of free trade. It was passed in October 2000, almost at the end of Clinton's reign. Once again the Cato Institute stood on the wrong side of the American worker, with Deroy Murdock professing that PNTR "will pressure China from inside and out" and that "Americans will enjoy more Chinese-made apparel and appliances at reasonable prices if PNTR passes." Of course the question we should have asked was, would Americans still have good jobs to purchase those low-quality imports from Walmart, Home Depot and other firms? The Cato Institute's Doug Bandow cajoled: "The silliest argument against PNTR is that Chinese imports would overwhelm U.S. industry. In fact, American workers are far more productive than their Chinese counterparts ... Moreover, Beijing's manufacturing exports to the United States remain small, about half the level of those from Mexico." The knockout blow came when we allowed China into the WTO (World Trade Organization) in December 2001. Clinton had disingenuously pledged that granting PNTR to China would "increase U.S. jobs and reduce our trade deficit." George W. Bush refused to slow the WTO train even though a Chinese military pilot had intentionally directed his aircraft into a U.S. EP-3 spy plane in April 2001, forcing it to land on Hainan Island where the plane was reverse engineered by Chinese intelligence personnel and the crew interrogated for ten days. Bush was so concerned that the incident might derail China's WTO membership that he wrote a personal letter to the widow of the Chinese pilot who caused the crash. Then one month after 9/11 he flew to Shanghai to work on the Doha Development Agenda in Shanghai to facilitate even more free trade. The Cato Institute's Daniel J. Ikenson promulgated in 2006: "In fact, since China joined the WTO in 2001, U.S. exports to China have more than doubled." He went on to avow: "And the notion that importing from and offshoring to China is hollowing out American manufacturing is not supported by the facts." Not according to CNN which recently reported that manufacturing jobs in the U.S. actually increased from 1994 to 2000, but then sank like a stone after that, with a loss of five million. Pat Buchanan astutely noted in February 2007: "To the devout libertarian, free trade is not a policy option to be debated, but a dogma to be defended. Nowhere is this truer than at that lamasery of libertarianism, the Cato Institute." He went on to say: "For contrary to free-trade mythology, every nation that has risen to pre-eminence and power -- Britain before 1860, the United States from 1860-1914, Germany from 1870-1914, postwar Japan, China today -- has pursued a mercantilist or protectionist trade policy ... It is no accident all four presidents who made it to Mount Rushmore were protectionists." 1985 was the year that Chinese imports into the U.S. became equal to U.S. exports to China and also the first year Census Bureau trade data is available. The below graph depicting trade with China from 1985 through 2015(see Census data here) depicts a lopsided trade relationship, good for China and multinational corporations which import goods, but not so good for the average American workers who witnessed their jobs being whisked away to foreign lands. The below graph depicting trade with Canada from 1985 through 2015 (see Census data here) is interesting, especially for 2015 when it dropped below the level of that for 2011-14. The U.S.-Canada trading relationship was until recently the greatest the world had ever seen, but now China has taken Canada's place. The balance of U.S.-Canada trade really hasn't changed much since 1985. The below graph depicting trade with Mexico from 1985 through 2015 (see Census data here) clearly shows the effect of NAFTA, as in 1994 exports pretty much equaled imports, but that's not true any more. Note that, contrary to Bandow's assertions, imports from Mexico are only about 3/5 those from China. The below graph depicting trade with Central America and the Dominican Republic from 2005 through 2015 (see Census data here) via CAFTA-DR (Dominican Republic - Central America Free Trade Agreement) illustrates a fairer agreement. Neither party dominates the other, though the U.S. has benefited the most for eight out of the eleven years the treaty has been in effect. Most Americans would probably not mind if most years were similar to 2013 given the abject poverty in these regions. That said, we cannot say that it has been a roaring success given the unprecedented levels of gang and drug-related violence. The below graph depicting the overall balance of trade from 1960 through 2015 (chart uses Balance of Payment basis; see Census data here) shows a number of things, but keep in mind that the graph is inverted, in other words, the more negative our balance of trade, the higher the graph rises. Perhaps I should have referred to it as the imbalance of trade. First, it hints at economic problems of the times. From 1972 to 1975, the trade balance went from -6,416 to 911 to -5,505 to 8,903. Your author suspects this blip originates in the 1973 gas crisis, when for the first time Americans started buying more gas-efficient foreign cars. At first people stopped driving, which slowed their buying, but after the gas crisis departed, many returned to purchasing gas hogs. There is no comparable blip for the 1979 gas crisis, but that was not nearly as bad as the first, not to mention that many people had already bought a foreign car. Second, it shows a clear correlation between the entrance of China upon the world stage and our increasingly negative trade balance. Our last positive trade balance was in 1975, with the value of 8,903 being the highest figure supplied by the Census Bureau (the second-highest was 7,006 in 1964). But then the trade balance went negative for good and almost quadrupled between 1976 to 1977, from 7,820 to 28,352. In 1982, the trade balance was 27,510, about average for the period of 1977-82. But in 1983 it jumped to 52,409, in 1984 it jumped to 106,702, and in 1987 it jumped to 152,119. And third, it indicates a precipitous rise just after the passage of NAFTA. The trade balance rose at a downright disturbing pace until 2006, when it leveled off just in time for the Wall Street crash. The trade balance became much better because many people lost their jobs and did not buy anything, foreign or domestic. The trade balance has mostly regained its depressing volume, but it has not climbed back to the level of George the Younger's final ruling days because job growth has been pathetic. At this point you might be thinking that employment moves in the same general direction, so it's all a wash. Not hardly. The ever-increasing trade deficit with China cost 3.2 million jobs between 2001 and 2013, with job losses in every state. As the below BLS graph (duplicate it yourself by visiting the BLS website and setting the starting year to 1948) indicates, the labor participation rate has dropped ever since the late 1990s. Currently it is equal to the rate for 1978, coincidentally when the balance of trade was just starting to become overt. Public Citizen's Global Trade Watch savaged NAFTA on its 20th anniversary and documented that it has been an unmitigated disaster, comparing it to the TPP (Trans-Pacific Partnership) which has been rather difficult to kill. Public Citizen noted: "The reductions in consumer goods prices that have materialized have not been sufficient to offset the losses to middle-class wages under NAFTA. U.S. workers without college degrees (63 percent of the workforce) have likely lost an amount equal to 12.2 percent of their wages under NAFTA-style trade even after accounting for the benefits of cheaper goods." Both Bernie Sanders and Donald Trump have called for the end of free trade and the beginning of fair trade because the former benefits mainly multinational corporations. Countering them are Ted Cruz who recently announced that Phil Gramm would be his economic adviser, with him being one of the people most responsible for the 2008 crash, Hillary Clinton who previously declared the TPP to be the "gold standard," and the Cato Institute which doubled-down on its previous statements, maintaining that opposition to the TPP is based on "nine myths." Remember Einstein's definition of insanity. 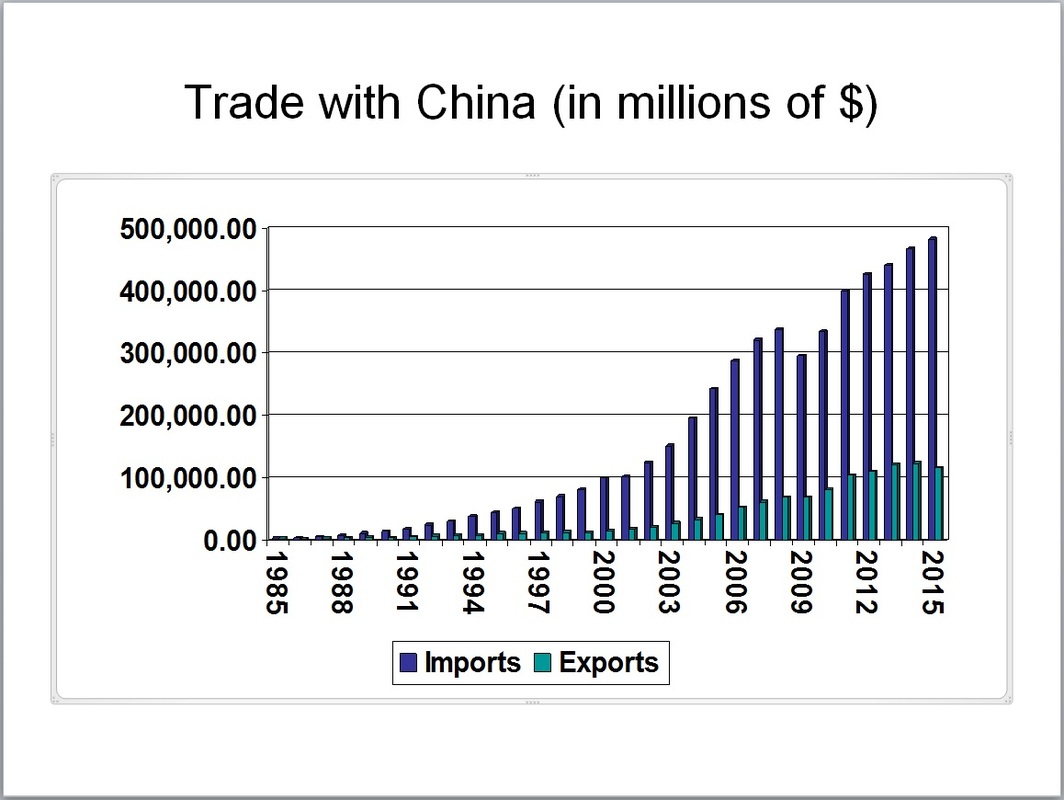 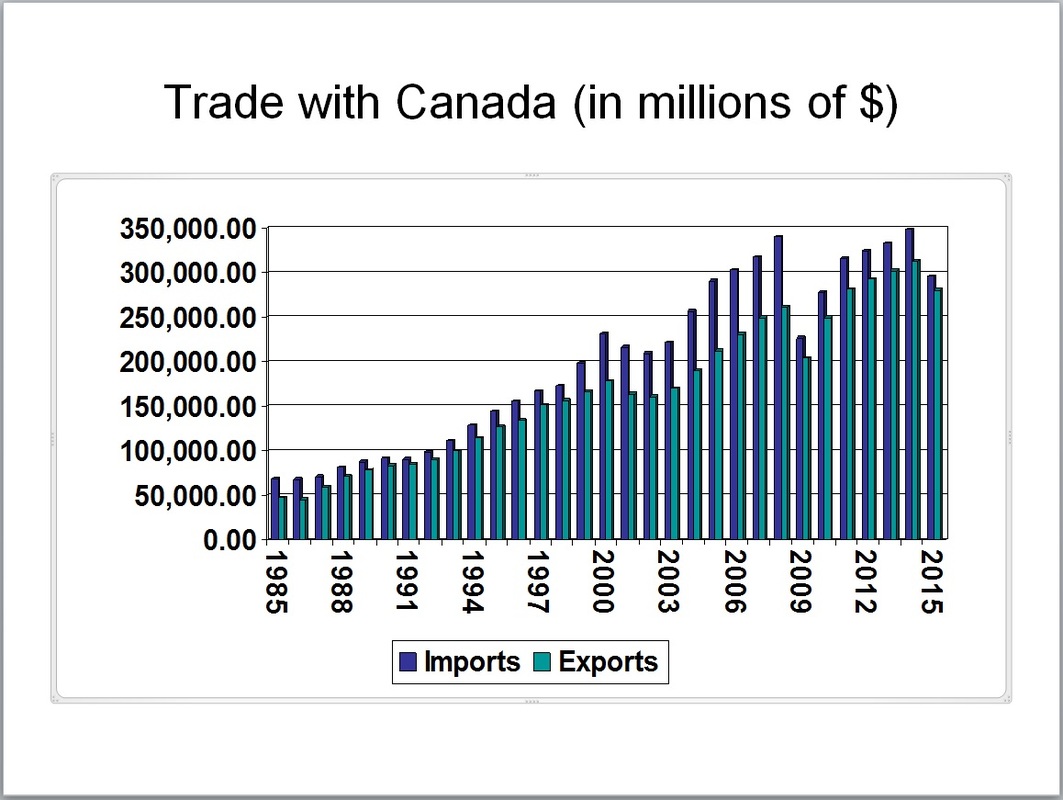 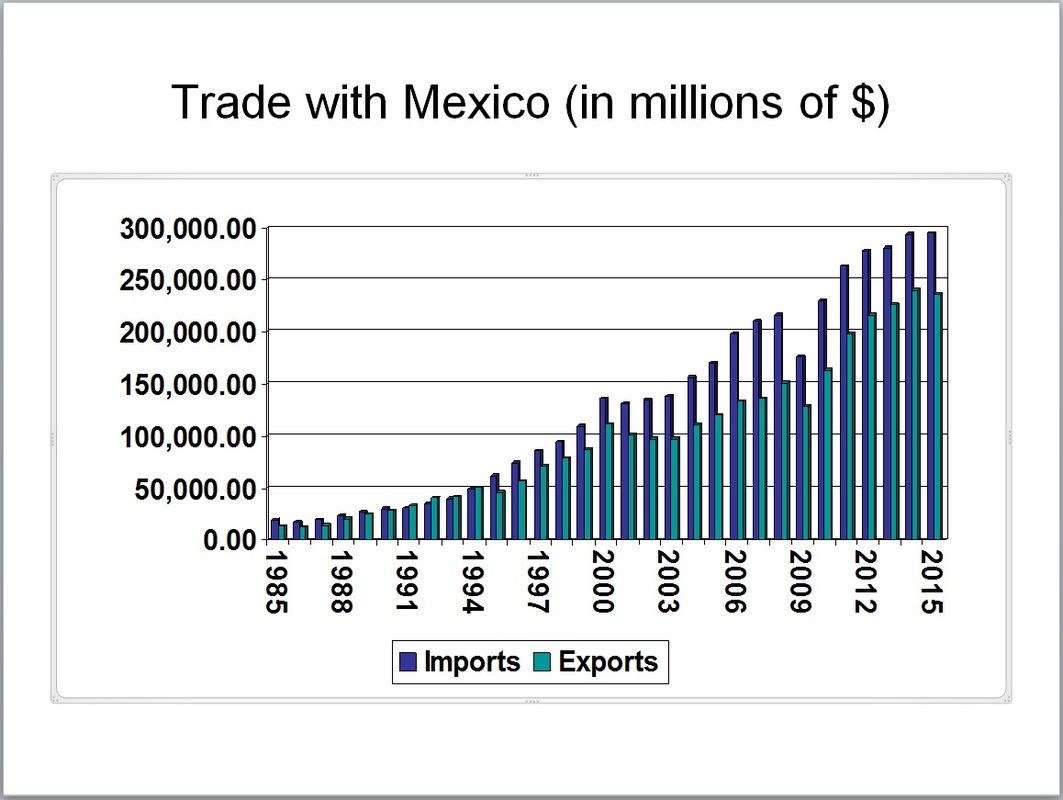 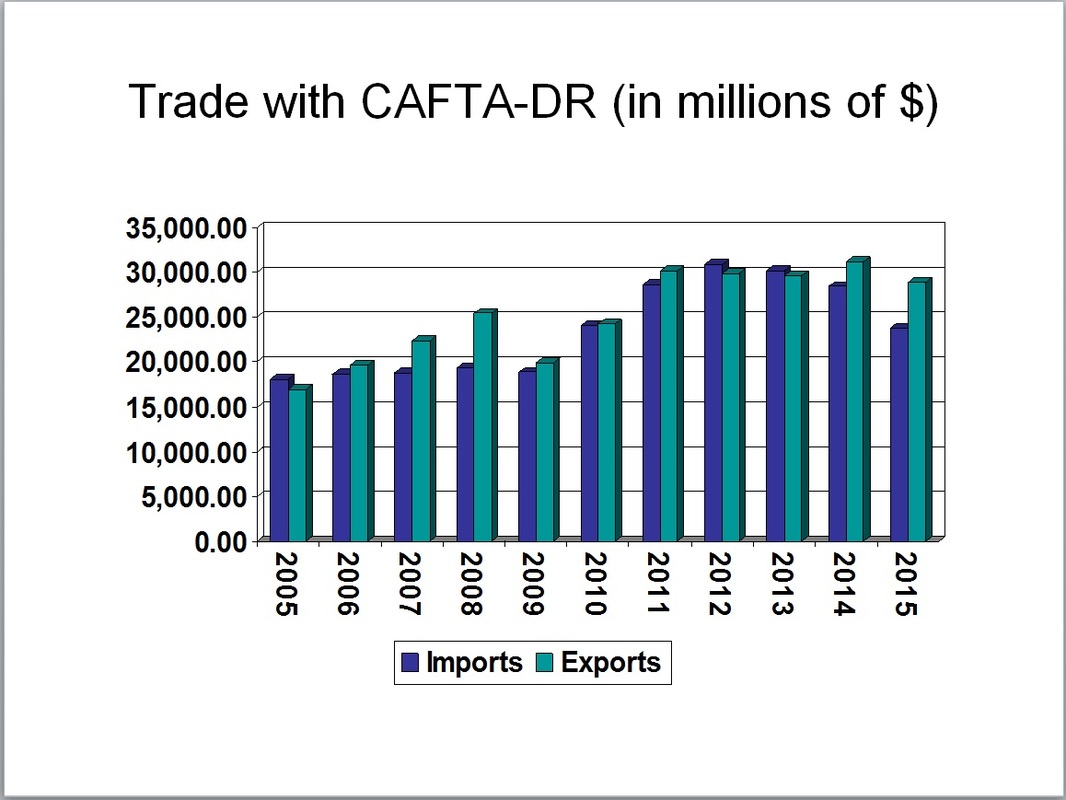 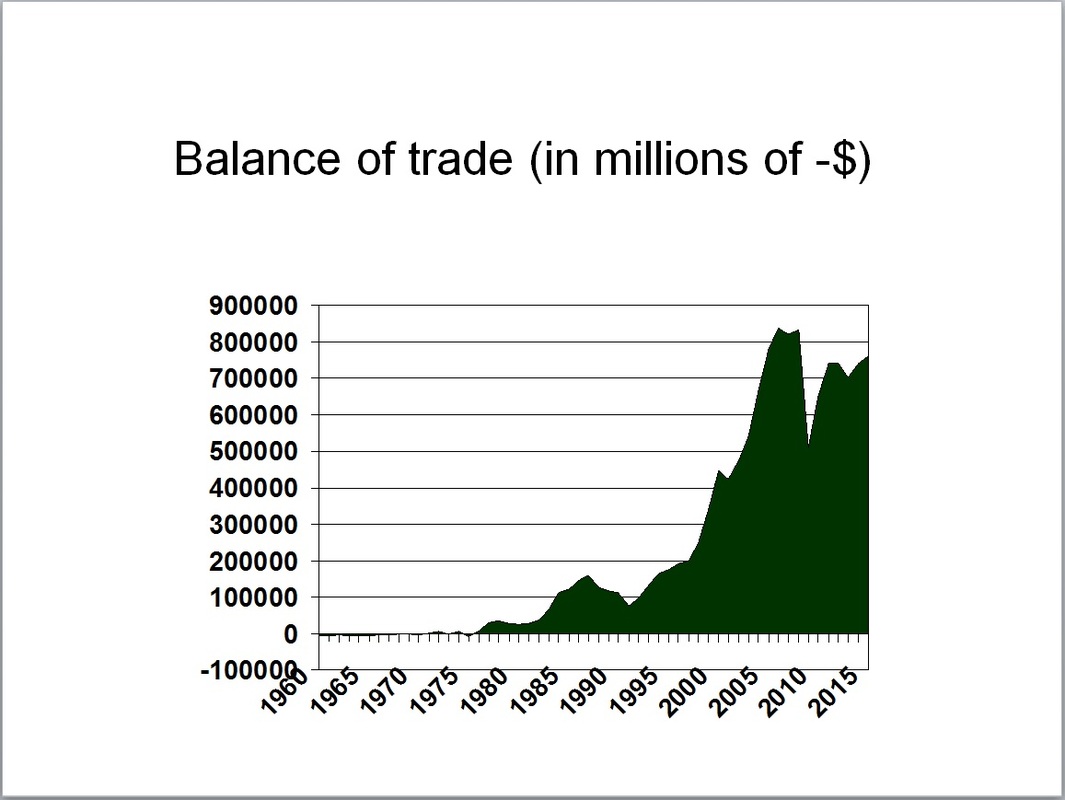 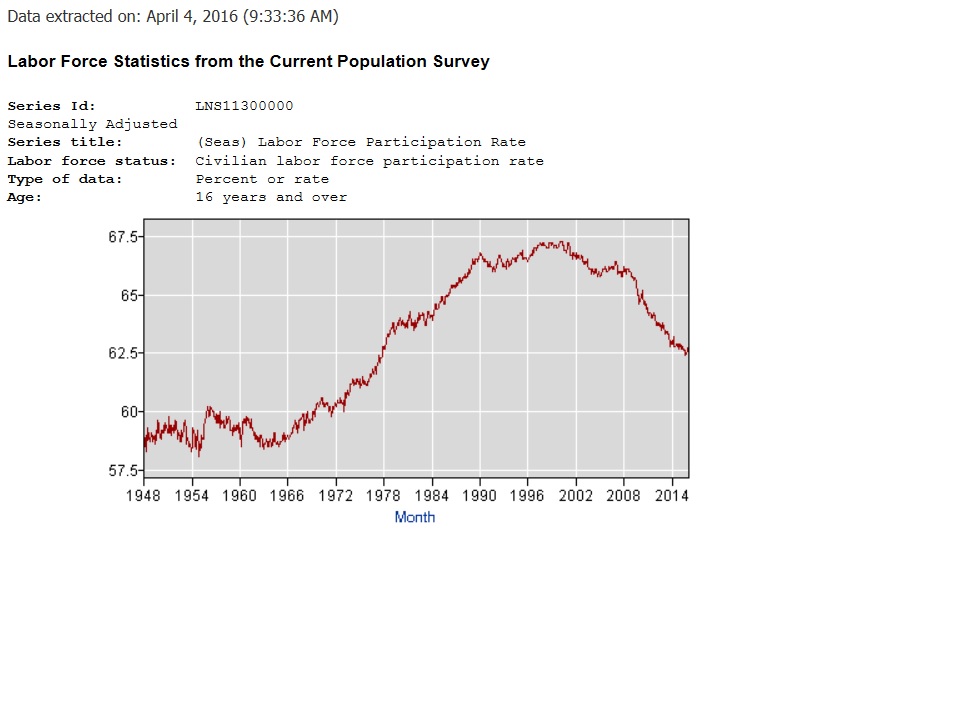
0 Comments
Your comment will be posted after it is approved.
Leave a Reply. |
AuthorPete Prunskunas Archives
March 2023
Categories |
 RSS Feed
